Graphing
It is important to organize the data you collect in any experiment. Creating a data table is one way to organize experimental data. Another way to show data is in the form of a graph. You can think of your graph as a “picture” of your data. Because of their visual nature, graphs can reveal patterns or trends that words and data tables cannot.
|
| ||||
| Organizing Data |
|
| ||||
Get a copy of the lab data here!
|
| ||||
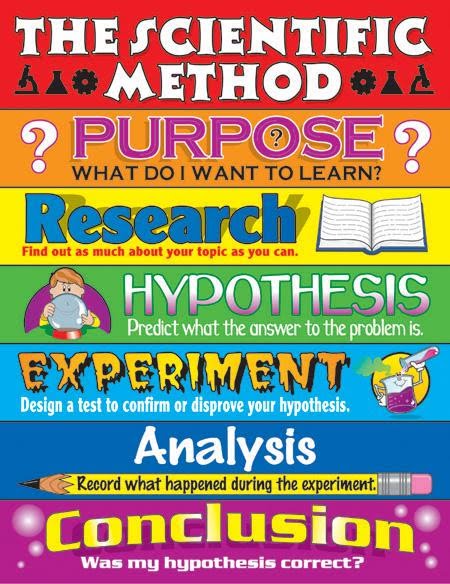
Scientific Method
|
| ||||
|
|
|
|
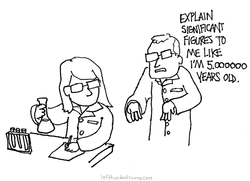
precision, accuracy & significant figures
|

| ||||||||
|
| ||||
|
| ||||
|
| ||||||||
Want some practice? Check out these pages...
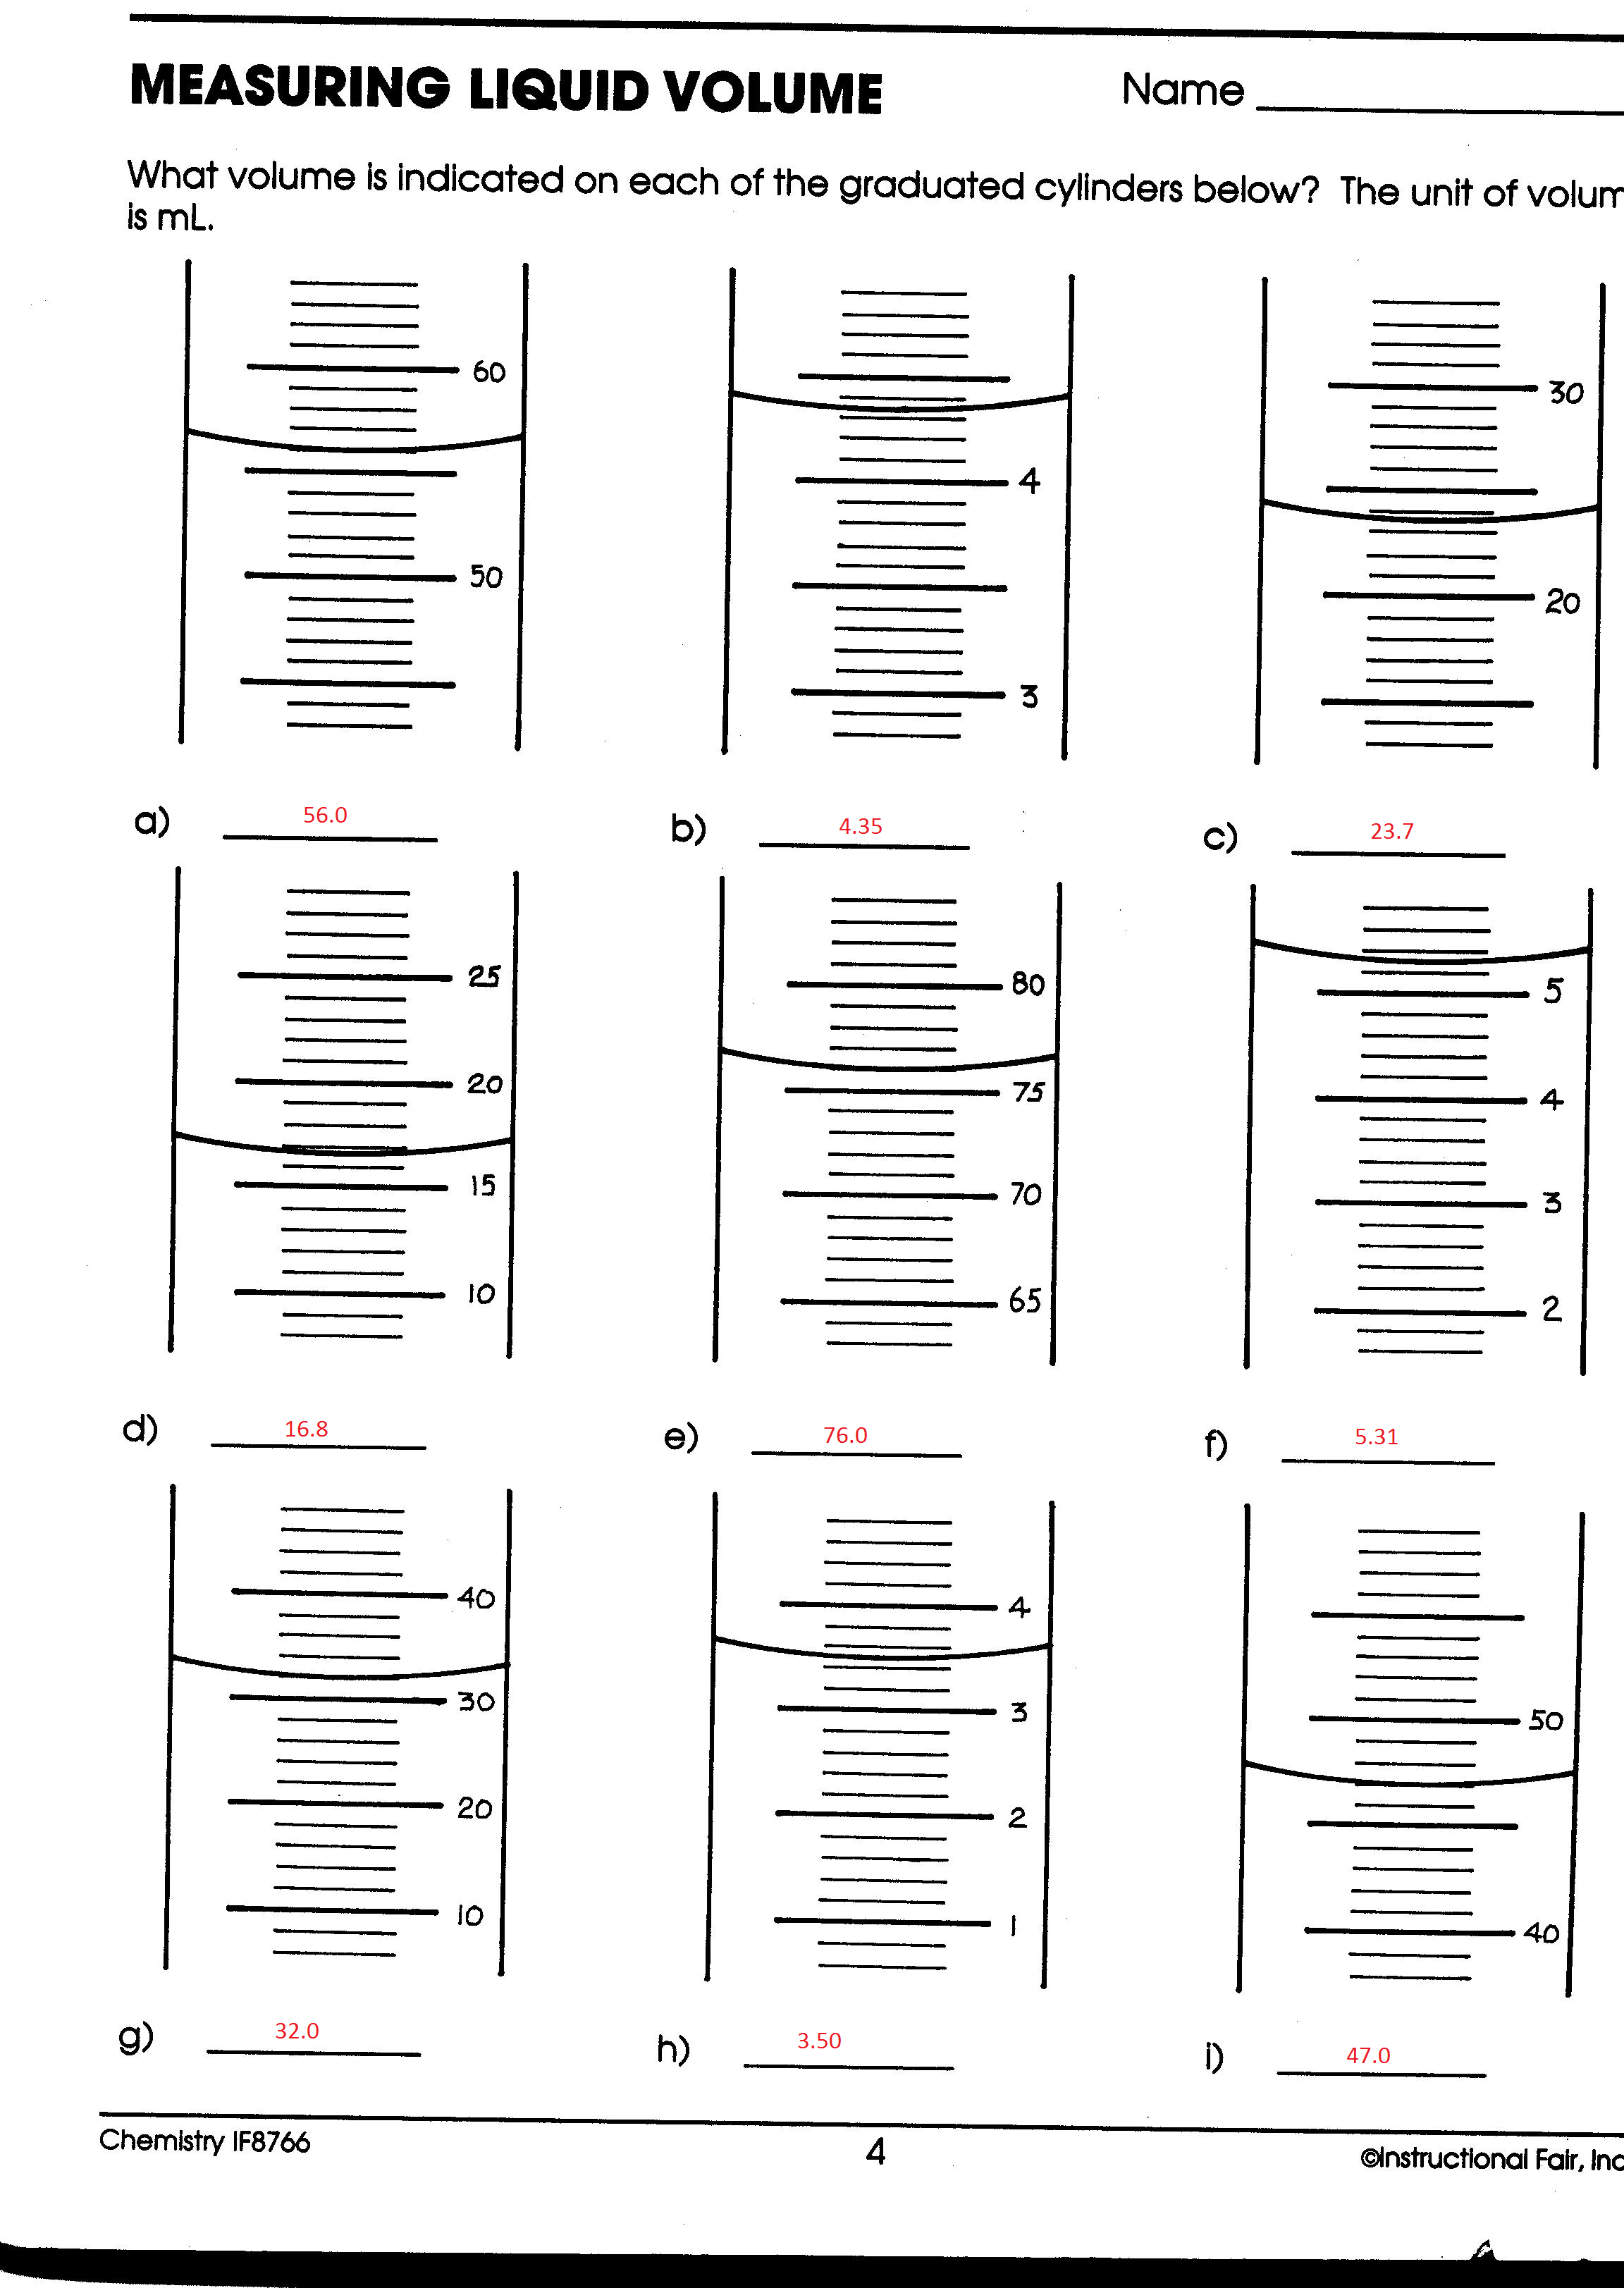
Measurement & Reading Scales
Counting Significant Figures
Operations with Sig Figs
Measurement & Reading Scales
Counting Significant Figures
Operations with Sig Figs
|
|
|
|
Unit Conversions
|
| ||||
|
| ||||||
|
|
|
|
Unit ii Review
|
|
| ||||||||||
| sigfigs_prefix_conversions_2015_answerkey.pdf |
| Unit 2: Introduction to Chemistry (Additional Notes) |
